
The world’s workforce demographics, housing markets, and social dynamics are about to be struck by a tidal wave of change. In this report, we delve into the underlying systems that stand broken, the shifts that are accelerating their reinvention, and the challenges and opportunities they present to the built environment industry — for seniors’ housing and care communities, and beyond.
This report is of interest to:
- Investors in private equity, real estate, and healthcare
- Developers of lifestyle/healthcare technology
- Designers and developers of seniors’ housing and care facilities
- Retirees and those nearing retirement
Key Terms: RISK, INVESTING, RETIREMENT, AGING, SENIOR HOUSING, COMMUNITY, PLANNING, DESIGN, HEALTHCARE, RECESSION, FINANCIAL SECURITY
Credits:
Dave Gilmore, President & CEO | Rob Hart, Senior Researcher
Chyenne Pastrana, Director of Marketing | Nicole Puckett, Lead Graphic
Designer | Beckie Hawk, Web Master
PART ONE: CUMULATIVE SYSTEMIC FRAGILITY
Go to Senior Living report navigation
The world’s population stands at a precipice.
As the baby-boom generation approaches retirement, they’re leaving one stage of life and entering another. From 2011 through 2030, 10,000 Americans will turn 65 each day. All told, some 70 million people will exit the US workforce in less than two decades. Workforce turnover at this scale has never happened in the history of any economy.
But why does this matter for the global community?
It matters because so many global developments converge with this major tipping point, affecting health systems, investment strategy, housing, politics, and the worldwide economy. To understand holistically how U.S. boomer retirement influences these global systems (and vice-versa), let’s examine a few prominent historical trends that shed light on our present moment.
Age Dependency Ratio
The age dependency ratio, which is the ratio of over-65 persons to 18-65 year-old persons in the US, is valuable in part because it reveals the shift in financial support structures.

POPULATION EXPLOSION
Go to Senior Living report navigation
Beginning with the Baby Boom generation, the global population expanded with astonishing speed.
Beginning with the Baby Boom generation, the global population expanded with astonishing speed. For perspective, in the 200,000 years preceding 1960, the number of humans grew by three billion. The next three billion took only 40 years.
Much of this rampant acceleration occurred in Southeast Asia and Africa. However, even the much smaller North American population increased by 79% in that time.
GLOBAL EXPANSION
In the two hundred thousand years preceding 1960, the number of humans grew by 3 billion. The next 3 billion took only 40 years. Much of this rampant acceleration occurred in Southeast Asia, Africa and North America.

Three interrelated factors contributed to this growth:
- Industrialized Agriculture, which allowed for
- Economic Prosperity, which promoted the expansion of
- Modern Medicine.
These three factors are neither linear nor additive, but cyclical and multiplicative — that is, each input multiplies the others’ impacts, accelerating systemwide growth. Consider agriculture, for example. Pre-industrial economies use most of their labor to grow food, which keeps people stuck in rural, uneducated, immobile lifestyles. Industrialized agriculture not only feeds more hungry people, but also frees them to urbanize, pursue specialized education, grow other economic sectors (e.g. energy, construction, manufacturing, and white-collar jobs) and enter fields like medicine.
Medicine doesn’t just improve life expectancy by prolonging old age, it also improves survival chances at birth. The Baby Boom generation
was a “boom” especially because more children survived birth and early childhood than ever before.1
As more children survived into adulthood, they exited the agriculture industry and entered specialized fields, leading to cumulative improvements to technology and medicine that made for more robust survival conditions for the whole population, including longer lifespans.
The result? We now have the largest number of seniors ever alive at one time.
INFANT MORTALITY RATE
The Baby Boom generation was a “boom” especially because more children survived birth and early childhood than ever before.

MATERNAL MORTALITY RATE
As more children survived into adulthood, they exited the agriculture industry and entered specialized fields, leading to cumulative improvements to technology and medicine that made for more robust survival conditions for the whole population, including longer lifespans.

FOOD FRAGILITY AND ECOLOGICAL THRESHOLDS
Go to Senior Living report navigation
Industrialized agriculture is a double-edged sword.
While it promotes social mobility by freeing up more people to specialize, it also increases the population’s dependency on narrower inputs. In 1790, some 90% of U.S. laborers worked in agriculture. In 2020, that number is less than 2%. Even in 1900, there were more than three times as many farms as there are today, but their acreage was less than half of what it is now.2
Since then, industrial farms have grown in area, reduced their labor needs, and accelerated productivity, holding efficiency standards similar to those of factories. In short, fewer people are now working larger territories to produce more food than ever before.
FArm numbers and Farm Size
In 1900, there were more than three times as many farms as there are today, but their acreage was less than half of what it is now.

EMPLOYMENT IN AGRICULTURE
The decline in agricultural employment has been a worldwide trend starting around 1900.

This shift is more efficient, but also increasingly fragile. Unlike manufactured goods, food comes from biological inputs rather than from technical ones. Biological systems are far more complex; they benefit from multiple redundancies and a diversity of nutrients. For a biological system, adding efficiency reduces diversity and complexity — it forces the system to draw on fewer, simpler inputs — reducing resiliency whenever those inputs are interrupted.
For example, in 1900, a 200-acre farm might grow one or two dozen food crop varieties, all with different seasons of flowering and fruiting. Each crop would draw certain nutrients from the soil while depositing others. Seasonal crop rotation could maintain soil nutrition and abundant yields without resorting to heavy external inputs. Surrounding forests and wilderness provided wildlife habitats, which were essential for crop health. Predator populations (such as songbirds and bats) would keep pest populations under control. Multiple pollinator species, such as bees and butterflies, would be just as diverse, promoting the crops’ reproductive cycles. While labor was intensive, the ecosystem was self-sustaining. A single population or crop faring poorly would do little to upset the overall equilibrium of the system; the remaining hundreds of species would maintain ample nutrient flows and restore balance to ailing species.
DIVERSE FARMING VS. MONOCROP FARMING
The Whitman Mission, top, represents a 1900 farm with diverse crops while the bottom represents monocrop harvesting.


Sources: Top photo, Whitman Mission at Waiilatpu by William Henry Jackson courtesy historylink.org. Bottom photo, courtey of thisismold.com
In modern agriculture, the classic image of the biodiverse farm is no more; the complexity of biological resilience has been traded for the efficiency of a factory system, with ever-increasing fragility. In 2020, a 450-acre farm tends to grow one or two “monocrops” in homogenous swaths, using one season for planting and one for harvest. Without prevalent crop rotation, farmers resort to the use of chemical fertilizers to replenish soil nutrients. These fertilizers produce diminishing returns. As their salt by-products accumulate in the soil, they make it less and less hospitable for the microbes that make soil nutrients digestible for plants.
To compensate for decreasing yields, farmers increase their fertilizer inputs for short-term gains but sacrifice the long-term viability of the soil. Within a decade or two, a once-abundant farm can no longer support crops, even with additional fertilizer. Used-up farmland then contributes to soil erosion, toxic runoff, and ocean acidification.
Meanwhile, surrounding wilderness that once housed diverse predator populations (i.e. free pest control) has now been cleared to make way for mechanized food processing or further monocropping. Pests are fought mainly via pesticides, especially neonicotinoids, which contribute to the collapse of pollinator populations. These pollinator die-offs threaten food crop fertility — and since the worldwide food web relies heavily on pollinator activity, this disruption threatens all plant and animal life.
INCREASED NEONICOTINOIDS USAGE
Pests are fought mainly via pesticides, especially neonicotinoids, which contribute to the collapse of pollinator populations.

U.S. HONEYBEE COLONIES
These pollinator die-offs threaten food crop fertility — and since the worldwide food web relies heavily on pollinator activity, this disruption threatens all plant and animal life.

Together, this confluence of factors reduces crop yields, raises input costs, and increases the threats posed by pestilence, blight, drought, famine, and economic failures. En route, it elevates risk levels from consequential to existential — it endangers our very existence.
Data show that 27% of insects have disappeared in just 30 years;3 on average, vertebrate populations have declined 60% since 1970;4 and 32% of all known species are now decreasing in abundance and range.5 Scientists are justified in calling this the sixth mass extinction event in Earth’s 4.5-billion-year history, and the first caused by humans. Sadly, one of the event’s first casualties will be our own food security.
For financial and medical reasons, food system fragility is immediately threatening for young children, pregnant mothers, and seniors citizens. Retirees on fixed incomes, especially in their vulnerable later years, face major economic and medical struggles if food systems collapse. Not only does food become unaffordable — it becomes less diverse, less nutritious, and less accessible.
Modern human food systems now rely on a smaller number of workers, plant species, and pollinators. As a result, it takes far less turbulence to raise food prices, cause severe food scarcity, or destroy entire biomes that supply our food. Turbulence can come from climate, geopolitics, warfare, pandemics, or economics — and any one of these disruptions makes the others more likely.
THE WEALTH GAP
Go to Senior Living report navigation
Alongside the population boom, the United States (and indeed, the entire globe) has produced an explosion of material wealth. In the U.S., most of this wealth is not distributed evenly among classes, compounding concerns of systemic fragility.
In the years following World War II — from the mid-1940s to 1970 — the growth in income and net worth was equal across the population. Rich and poor saw about the same percent increase in wealth. Around the mid-’70s, the wealth gap began to widen dramatically.6 The very rich began to outpace the slightly-less-rich, who left the middle class far behind. For over a decade, the poorest Americans actually saw much of their wealth stagnate or collapse through unemployment and inflation, while the wealthiest Americans set new earnings records.
Not only has the wealth gap between classes widened, but also between races. Since 1963, the median white household’s net worth has grown by more than $123k (in 2016 dollars), while that figure for the median hispanic household has grown by only $18k, and by only $15k for the median black household.7 The black-white income gap has remained in place,8 and the homeownership gap is now at its widest point in fifty years.9 As researchers at the Urban Institute point out, these disparities accrue with age, affecting minority seniors most of all.10
Income Gap grows
Income gains were shared widely in the early postwar decades until around 1980 when the gap between the 95th percentile and the median income seems to widen. Income percentages listed based on 1973 level.

We acknowledge the magnitude of these systemic inequities, yet we realize it may be beyond the scope of this paper to address them to the depth they deserve.
Over the years since 1970, the wealth gap has widened dramatically: each new boom shunts more wealth to the top 1%, while each new bust hits the lowest tiers the hardest. In their analysis of the expansion following the 2008 recession, the Harvard Business School found that over ten years’ time, 71% of net worth increases went to the richest 10% of the population, while only 3% of the gains went to the bottom 50% of households.11 During the first three months of the COVID-19 pandemic, U.S. billionaires’ net worth grew by more than 20%, while over 45 million Americans filed for unemployment.12
In the aggregate, these transfers of wealth make our economy fragile. Today, income and net worth are as stratified as they were in the pre-depression 1920s.13 Historically, this magnitude of wealth concentration is a harbinger of instability and a predictor of a wide range of social problems.
For the poor, the safety net is slim — just a few weeks of unemployment could put many at risk of bankruptcy, homelessness, and starvation. It also bodes ill for small business growth, as the middle class has so little room to take risks. And although a great deal of wealth has been amassed by the top 1% of earners, that wealth is less functional in their hands than it would be if accessible to the middle class for small business development.
INCOME DISPARITY among Households Age 65 and older
The disparity between incomes of older households continues to increase, especially for those in the 90th percentile.

For seniors, this wealth migration means they have less income or net worth for retirement — a vanishing safety net as the economic system destabilizes.
The social problems of stratification are unlikely to fix themselves. Rather, they tend to worsen over time. In the preface to The Price of Inequality, Nobel-Prize-winning economist Joseph Stiglitz writes:
Not only doesn’t the money given to the top not necessarily go into “job creation” and innovation; some of it goes into distorting our politics … We are, in fact, paying a high price for our growing and outsized inequality: not only slower growth and lower GDP, but even more instability. And this is not to say anything about the other prices we are paying: a weakened democracy, a diminished sense of fairness and justice, and even, as I have suggested, a questioning of our sense of identity.14
Thus, economic destabilization has led to social insecurity. As a result, seniors are more vulnerable to poverty (and therefore food instability), and the social and governmental programs they lean on for support are growing less and less reliable.
SHARE OF INCOME GAINS
Todays’ income distribution is as stratified as it was in the pre-depression 1920s.

GOVERNMENT MISTRUST
Go to Senior Living report navigation
In the 1960s, trust in the U.S. government polled at or above 70%, and sometimes as high as 77%.15 People generally believed the government to be fair, competent, and trustworthy.
These favorable opinions came from both ends of the political spectrum and across all age groups. Disagreements with leadership tended to focus on policy or procedure, rather than personality, performance, or power asymmetry.
At the end of the decade, trust in government fell sharply across the political spectrum and has never recovered. Over the next ten years, this loss of trust continued in response to the Vietnam War, the Watergate scandal, and the economic crises of the ‘70s. By 1980, only 25% of people said they trusted the government “all or most” of the time.
PUBLIC TRUST in GOVERNMENT
Public trust in the government remains near historic lows. Only 17% of Americans today say they can trust the government in Washington to do what is right “just about always” (3%) or “most of the time” (14%). For years with multiple polls, their average was taken.

While over time different groups have adjusted their trust based on their circumstances (for instance, whether their favored party was in the White House), the average level of trust has held steady at less than 25%.16
The coronavirus pandemic has challenged the U.S. public’s trust in government even more deeply. In a series of three surveys taken since the start of the crisis, global consulting firm ICF has uncovered a sharp downward trend in confidence in local, state, and especially federal government. All told, the share of those who trust the federal government’s handling of the COVID-19 outbreak fell seven percentage points in just eight weeks.17 As new cases and death tolls continue to escalate, trust continues to erode.
Baby Boomers may recall a time in their early teens when the government was widely seen as a trustworthy institution, but that sentiment is now a faded memory of a bygone era. In contrast, the most recent decade has seen the lowest levels of trust on record.
The implications for today’s seniors are profoundly uncomfortable: as economic stratification increases and social support deteriorates, the governing institutions we most need to protect our seniors are less trusted to respond in good faith or competency. As we will see, seniors have ample reason not to put blind faith in government.
TRUST IN GOVERNMENT INFORMATION ON THE PANDEMIC
Public trust in the information shared on the coronavirus (COVID-19) from the federal, state and local government as well as public health experts has steadily declined through each wave of the pandemic. Respondents indicate whether they trust the information “a fair amount” or “a great deal.”

Economist Charles Goodhart once wrote, “When a measure becomes a target, it ceases to be a good measure.”18 Now known as Goodhart’s Law, this principle underscores a very real problem with the way social and monetary policy are often carried out:
1) measure performance,
2) assign a target, and then, strangely,
3) manipulate performance parameters to make it seem like the target was reached,
while underlying performance suffers.
CONSUMER PRICE INDEX (CPI)
Built from a selection of goods and services deemed essential, the CPI is meant to measure changes in the cost of living, and report those changes as inflation.
Read more "STATS BEHIND THE CURTAIN"
As an example, when standardized test scores are used to punish underperforming teachers and schools, the scores undermine education. Knowing their careers depend on grades, faculty must “teach to the test,” or equip students for testing rather than for independent thinking, learning, and living. As a consequence, classroom experience becomes less applicable in the real world; students may leave school with higher grades, but enter the world less prepared for the challenges of adult life. Though intended to ensure progress, the target creates perverse incentives that impede progress.
According to Goodhart, a similar pressure builds behind any measure that becomes a target — even the inflation rate, as measured by the Consumer Price Index (CPI). Built from a selection of goods and services deemed essential, the CPI is meant to measure changes in the cost of living, and report those changes as inflation. (Note: many economists contest whether even a perfect CPI would actually measure inflation, the currency’s loss of purchasing power.)
The problem is that a host of economic and social structures have now been built on top of the CPI framework, and these structures determine the financial standing of senior citizens. From investment projections and actuarial tables to Social Security and private pension benefits, and from wage increases all the way to Real GDP (often seen as the vital sign of economic health), all of these systems rely on CPI as a primary metric. A half-percent change in the CPI can compress or inflate trillions of dollars in program funding and public benefits. For investors, future gains must beat the inflation rate, which means the CPI also influences aggregate market behaviors like the buying and selling of shares.
In short, the measure has become a target — a target painted on the backs of today’s seniors.
The problem becomes clearer when we understand CPI’s essence. At its core, it represents price fluctuations in a selection of goods and services that are deemed essential by a nonelected committee. What should be an objective measure is, in reality, quite subjective and malleable: bureau officials choose which goods (and how much of each at which prices) to include in the metaphorical “basket” of indexed goods. This yields three ways the CPI’s value can change:
1) the price of an item rises or falls,
2) the Bureau of Labor Statistics decides to add or remove a price category from the basket, or
3) they change the weight of an item relative to other indexed goods.
Indeed, the Bureau changes the basket and its weighted algorithm regularly. Unsurprisingly, it seems there’s a move to conceal the exact adjustments made to the index. The Bureau uses a method it calls “Hedonic Adjustments” to upgrade or downgrade a category based on perceived quality improvements in production. Formerly, it published the exact change factors and the reasoning for each change. Sometime between 2017 and 2019, that information disappeared from the Bureau’s website,19 and was quietly replaced with a less transparent, non-quantitative list.20 As of 2017, the public can no longer check under the hood of the algorithm used to calculate the index.
But we citizens can still do our own math. The 20-year average annual inflation rate (from 2000 through 2019) was officially 2.2% — but in that same period, the cost of healthcare, education, and childcare more than doubled (and in the case of college tuition, costs increased by a factor of 2.7).21 This should only happen if inflation on those categories were between 3.6% and 4.7%, not the reported 2.2%. While these rates are supposedly offset by changes to other goods in the index — such as energy, housing, food, and cars — these, too, have increased in price. Price shrinkage has indeed occurred on a few indexed items (specifically, televisions, clothing, and toys), but a true “cost of living” index should properly weight such items as being significantly less essential than healthcare, education, or childcare. The non-essentials also account for far less of a household’s budget, so their fluctuations should count that much less when estimating inflation.
Skeptical economists have begun to devise their own methods of estimating inflation via factors other than CPI. David Ranson, formerly an assistant to the U.S. Secretary of the Treasury, prefers to chart inflation against precious metals. In an interview with the Financial Post, Ranson said, “The government has a lot of leeway in designing the methodology of the Consumer Price Index. This is true in all countries, especially in the United States, and they are fixing the CPI so that it doesn’t move very much… each time they change the methodology, it’s more rigid, and slower moving… It’s a tiny fraction of the amount of inflation that’s actually going on if you look at other flexible prices.”22 Based on market prices of precious metals, he estimates inflation to be about four times more than the CPI at any given time.23
COST OF CONSUMER GOODS VS. INFLATION RATE
The cost of healthcare, education, and childcare has more than doubled (and in the case of college tuition, costs increased by a factor of 2.7) over the last 20 years.

Economics journalist Charles Hugh Smith takes another approach, with a similar outcome. Writing for Business Insider, he walks his readers through the calculations for several categories including food, health insurance, public university tuition, rent, and even waste disposal. In each, he finds costs of living to be consistently 4.5 times more inflated than the CPI would indicate.24
Lastly, economist John Williams reports an alternate CPI based on the same methodologies used by the Bureau in 1980 — thereby eliminating any basket-based tinkering that may have taken place since. Independently of the other economists, his measurements still yield 4 to 4.5 times more inflation than the officially reported rate.25
If three independent economists, using three distinct methodologies, all find inflation to be in the same range — and the USA’s official metric reflects less than a quarter of that inflation — then the last 20 years averaged closer to 10% rather than the reported 2.2% annual inflation.
SO WHAT ARE THE IMPLICATIONS?
1) U.S. monetary policy, which spent the last decade attempting to raise inflation through quantitative easing, has been headed in the wrong direction. As if bailing water into the boat, the Federal Reserve has been siphoning purchasing power out of the public purse and pumping it into private investment accounts, effectively trying to “inflate our way out of the recession.” This has had the impact of diluting the currency without changing the official CPI. Meanwhile, it creates a bubble in the investment landscape that cannot hold. Not inconsequentially, it also widens the wealth gap by inflating equities while punishing consumer spending.
2) Most seniors’ retirement investments have been woefully underfunded, based on an inflation metric that far underestimates their real future costs. Those saving for retirement won’t have the actual purchasing power they need when the time comes.
3) Social Security benefit payouts, anchored to inflation rates, are not keeping pace with actual costs of living, and will lag further as the years progress. Since most people plan on covering a significant amount of costs through Social Security, they’ll be poorer than they expect in retirement.
4) Private and public pension benefits, all calculated (and funded) using CPI, are failing to provide for seniors’ costs of living, and will perform exponentially worse in the future, with serious consequences for public budgets and senior citizens’ lives.
In summary, this storm hits seniors from three angles at once: it underpays them on benefits, under-warns them about savings, and undermines the stability of their investments.
OVERPROMISE AND UNDER-DELIVER
Go to Senior Living report navigation
Social Security and Public Pension Insolvency
Unfortunately for seniors and soon-to-be seniors, the financial news gets worse.
Not only are Social Security benefits and pension payouts unfairly compressed by CPI — these programs are also grossly underfunded even by their own published standards, pushing public and private support systems to the brink of insolvency. Economists and journalists alike have tried for years to sound the alarm, but policy response from Washington has been minimal.
Laurence Kotlikoff, professor of economics at Boston University, wrote in May 2019:
On the right side of Social Security’s balance sheet are its liabilities ... its projected benefit obligations ($176 trillion) to current retirees, current workers and future workers.
On the left side are the system’s assets. These are the value of the system’s peanut-sized trust fund ($3 trillion) and the present value of its projected payroll tax receipts ($130 trillion) from current and future workers. Balance sheets are meant to balance, hence their name. When they don’t, look out. It means the entity is bankrupt.26
SOCIAL SECURITY’S FUTURE
The projected shortfall is more than double the US’s entire GDP.

Notice that the “assets” column is only 2% real liquidity and 98% as-yet-uncollected payroll tax revenue. There are at least three problems with this situation: 1) it doesn’t come close to covering liabilities, 2) its “present value” is derived from a faulty CPI, and 3) it doesn’t allow any margin for downturns in payroll tax revenue (from recession or mass unemployment, for instance).
Less than a year after Kotlikoff’s analysis, the global coronavirus pandemic arrived. Since the pandemic began, over 45 million U.S. workers have filed for unemployment,27 casting serious doubt on the aforementioned payroll tax projections. The already-scant “assets” column has shrunk considerably in 2020. As we enter a decade of Social Security’s greatest-ever projected withdrawals, the program’s funding is at an all-time historical low.
Public pensions, though smaller in volume than Social Security, are in a similar position financially — and analysts at the National Bureau for Economic Research have been raising concerns since 2008.28 The AARP estimates only 10% of U.S. Baby Boomers have a pension,29 but economists agree that pensioners themselves aren’t the only ones affected by underfunded programs. In addition to pensioners, all residents of a state are affected when it defaults on debt obligations. Experts at the University of Pennsylvania estimate the total of U.S. unfunded public pension obligations to be at least $4.4 trillion.30 Forbes cites a more alarming $6 trillion — over a quarter of the national debt.31 This is money owed by state and local governments, whose smaller budgets and stricter fiscal policies allow far less debt than the federal one.
NATIONAL PENSION DEBT PER HOUSEHOLD
Alaska, Connecticut, California, Hawaii, Illinois, New Jersey and Ohio lead the states in total pension debt (divided by the number of households). Together, they represent 24% of the US population.

Even the Pension Benefit Guaranty Corporation, the federal agency responsible for insuring pensions that have gone bankrupt, is itself going bankrupt. In 2017, auditors at the U.S. Government Accountability Office looked into the PBGC and found that “there is an over 40 percent chance that the multiemployer program will be insolvent by the year 2024. After that, the risk of insolvency rises rapidly — reaching over 90 percent by 2025 and 99 percent by 2026.”32
What happens when these programs run out of money? In the case of Social Security, MarketWatch sums it up:
Congress has a few options: it can pass a law to keep benefits at the same level, which would increase the country’s deficit, or it could choose to raise the age that Americans get benefits or [it could] increase payroll taxes. If nothing is done, which experts say is unlikely, all beneficiaries would get 80% of scheduled benefits.33
It’s likely we’ll see some combination of the above approaches — ballooning the deficit (which compresses GDP), lowering benefits and raising age limits (which hurts seniors), and increasing payroll taxes (which hurts workers). The case of public pensions looks less clear, but two solutions getting the most attention are:
A.) Let states declare bankruptcy and default on pension payouts, in which case the retirees get nothing, or a small fraction of their promised benefits, or
B.) Use the federal budget (supported by the income tax) to bail out the insolvent state governments and pay their obligations (which means U.S. taxpayers cede $4-6 trillion from their paychecks)34
Since neither approach looks entirely fair to the public eye, these programs’ insolvency threatens to divide the country by age. Those who remain in the workforce may face higher taxes, a more depressed economy, and a less secure retirement in the future, so they have every incentive to resist bailout measures. On the other hand, those reaching retirement age soonest have planned their lives — their very survival — around the defined benefits they were promised, and cannot afford life without them. Yet, as we will see, this division will only compound the political polarization that is already threatening to destabilize the country.
WHAT HAPPENS WHEN THE MONEY RUNS OUT?
Congress has three options with Social Security.

Political Polarization
Go to Senior Living report navigation
Polarization between political parties isn’t a static force. Rather, it has gradually increased over the last several decades and has never been more pronounced than it is today. For seniors facing an impending crisis, this trend obstructs the process of getting public policy to meet public needs.
There are many ways to measure polarization. Some examine correlation patterns in the population’s voting or opinion polling,35 while others look at political outcomes.
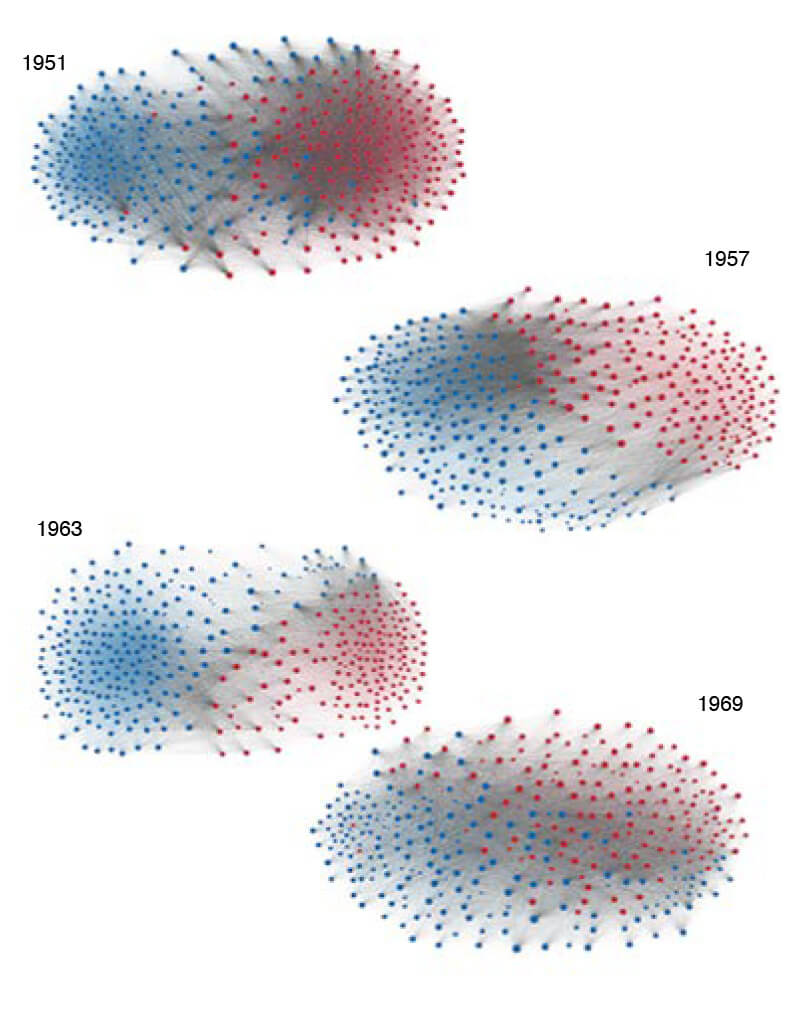
Perhaps the most unmistakable evidence of polarization appears in a multi-decade analysis of legislative cooperation.36 Pictured in the study is a quantitative-graphical analysis of voting records for the U.S. House of Representatives since 1949. The study’s researchers used an algorithm to turn voting data into a visual depiction of legislator cooperation. Legislators appear as nodes in a network; their party determines their color, and their voting habits determine their position in space, relative to other nodes. If two legislators vote alike (regardless of party affiliation), the algorithm places them close together on the graph and draws a line connecting them. If they differ widely, they appear far apart. This empirical design creates an unbiased illustration of legislator behavior over time.
HOUSE VOTING RECORDS
This study is a quantitative-graphical analysis of voting records for the U.S. House of Representatives since 1949. The study’s researchers used an algorithm to turn voting data into a visual depiction of legislator cooperation. The visualization shows how likely the House of Representatives’ Democrats (in blue) and Republicans (in red) are to vote with their own party or to cross party lines.
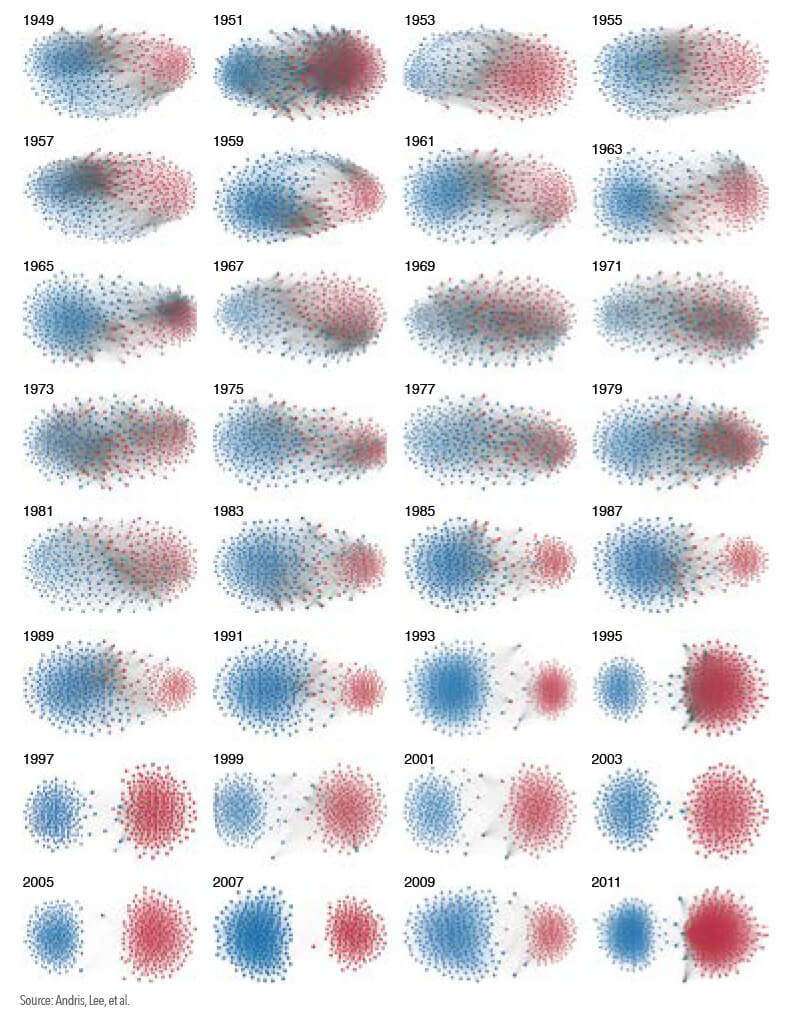
In a less polarized atmosphere, members of both parties can and do agree on legislative goals, often voting together on the same resolutions. Through cooperation, they’re able to enact reforms, rebuild infrastructure, and balance budgets with some amount of give-and-take on both sides. This would be an accurate description of the U.S. House of Representatives in the ‘50s and ‘60s.
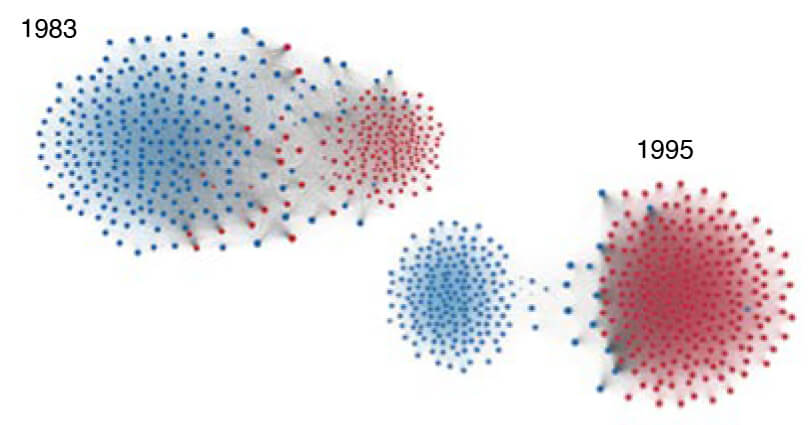
Notice how the shape of the graph changes significantly throughout the ‘80s and early ‘90s. At the start of the ‘80s, nodes are closely connected by many grey lines, signifying healthy cooperation. But this pattern gradually shifts. By the mid-1990s, an entirely different picture appears: two distinct masses of tightly grouped nodes, cooperating almost exclusively within their parties. Any degree of cross-party cooperation seems to emerge from “defector” nodes rather than bridges, and therefore disappears by the next election cycle.
In a less polarized atmosphere, members of both parties can and do agree on legislative goals, often voting together on the same resolutions (graphically, these cross-party agreements appear as gray lines connecting red and blue nodes). Through cooperation, they’re able to enact reforms, rebuild infrastructure, and balance budgets with some amount of give-and-take on both sides. This would be an accurate description of the U.S. House of Representatives in the ‘50s and ‘60s.
A more polarized atmosphere sees a reduction of cross-party voting (gray lines) and more in-party voting (red or blue lines). Graphically these changes are also represented spatially, as some nodes move further away from other nodes when they share less voting behavior. Conversely, nodes cluster more tightly when a group’s voting behavior becomes more homogenous.
Notice how the shape of the graph changes significantly throughout the ‘80s and early ‘90s. At the start of the ‘80s, nodes are closely connected by many gray lines, signifying healthy cooperation. But this pattern gradually shifts. By the mid-1990s, an entirely different picture appears: two distinct masses of tightly grouped nodes, cooperating almost exclusively within their parties. Any degree of cross-party cooperation seems to emerge from “defector” nodes rather than bridges, and therefore disappears by the next election cycle.
What we see depicted in the post-1995 legislation record is a house divided against itself. This mirrors trends seen in other polarization metrics, including the inflation of campaign fundraising for both parties, who now have to stock their war chests for all-out combat each election cycle.37 Interestingly, political donors in 2016 were twice as likely to be seniors as compared to any other age cohort.38 Are seniors being exploited to fund this destructive partisanship, while their own needs are ignored?
An analysis by Katherine Gehl and Michael Porter of the Harvard Business School suggests partisan gridlock is at the root of the economic and structural stagnation of the last several decades. In a 2019 whitepaper titled A Recovery Squandered, they write,
Unhealthy competition in the political system, stemming from rampant optimization of self-serving rules and structures, is the root cause of the decades-long inability of our government to make progress on America’s most pressing economic and social problems.39
Rather than pin these flaws on a particular party, they implicate both. They also note a rise in registered independent voters — now at an all-time high — who outnumber registered democrats or republicans. As they point out, however, this shift hasn’t been enough to depolarize our leadership:
Few moderates, and almost no Independents, can get elected, even though 41% of citizens in 2019 self-identify as Independents. And, even if a problem-solving candidate is somehow elected, the duopoly has put in place self-serving structures to control the legislative process.40
In their report, the analysts put forward a succinct recovery plan, complete with actionable, non-partisan reforms that would re-integrate these disenfranchised independents and moderates, and put the government back to work for the people.
But the depolarization of the voting public is happening slowly, starting with the young. According to a Gallup poll, the bulk of registered independents are between 18 and 64 years old; most registered seniors, as of 2014, were still with one of the major parties.41 The recent rise in independents has diminished the other two parties’ numbers about equally.42
While the group of independents has grown substantially over the last decade, their influence has yet to unseat the two-party system that controls the economic and social landscape. It remains to be seen whether their collective political force might push the nation into a new, post-partisan political paradigm. One thing is sure: the two-party, 30-year stalemate cannot continue without extreme losses in the public sphere. Seniors’ needs, meanwhile, continue to be unmet by this stalemate.
Individualism vs. Interdependent Community
Go to Senior Living report navigation
The U.S. historically prides itself on individualism, the belief in a single person’s value and capacity to make change.
What’s less obvious from our present cultural position is that we once prided ourselves on collective values, too — values like feeding the poor, cooperating to solve problems, supporting those without the ability to support themselves, and caring for the elderly.
While highly subjective, and thus difficult to measure, these two value sets appear to ebb and flow over time in any culture. During World War II, collective values held a more prominent place in western cultures. Ever since the war ended, individualism has been on the rise all over the globe, especially in the United States.
One way to measure whether people are generally individualistic or interdependent in their thinking is to study housing preferences. Since 1960, the share of single-person households in the United States has more than doubled43 while family size has shrunk,44 indicating a rise in individualistic lifestyle choices such as singles living alone, a delay of family establishment, and a departure from multigenerational living.
Another way to distinguish whether people are thinking individualistically or collectively is to examine popular culture, baby names, and parenting styles. A study published in the Journal of Personal Psychology found a striking correlation between economic booms, individualistic parenting, and me-centered pop culture iconography.45 When the economy grows, individualistic mindsets prevail; when it shrinks, people become more group-oriented.
Similarly, a study published by the Association for Psychological Science found that in a wide variety of cultures and conditions, individualism correlates with phases of prosperity, and collectivism follows times of uncertainty.46 The study included 51 years of data from 78 countries. In all these cultures, people favored collective values when they faced economic hardship, infectious diseases, natural disasters, and climate disturbance.
It is therefore telling that since the 2008 recession, the United States has shown the first increase in household size in over 160 years.47 Multigenerational households are also returning to the fore. These effects are seen mostly in the under-55 demographic, however; over the last 10 years, the share of Baby Boomers living with more than two people has only grown by one percentage point.
By these indicators, today’s seniors are missing out on what may be the biggest difference-maker in human longevity and wellness: community. Beginning in the 1960s, the small town of Roseto, Pennsylvania came to the attention of the medical industry when it was realized that, despite their high-cholesterol diets and prevalent smoking, residents of the town had less than half the expected rate of heart attacks and a proportionally longer life expectancy.48
By comparison, the nearby town of Bangor, with similar genetic heritage and diet, had more than twice the rate of heart attack-related deaths, even while showing the same levels of cholesterol. The major difference between the towns was social: Bangor was highly individualized and Americanized in its values and behaviors, while Roseto had maintained a community-centered lifestyle reminiscent of its Sicilian roots. The latter town showed a high prevalence of multi-generational households, closely-knit families, frequent large gatherings, many shared meals, and a tendency to depend on one another for basic needs.49
Over the years, Roseto began to change its way of life, losing much of that interdependence and becoming, in the words of the medical researchers, “Americanized” in its values. In the formal summary of the 30-year study, a lead researcher noted, “the communities were followed prospectively for 30 years during a striking social change in Roseto toward less family and community cohesion and more commitment to individual goals and adherence to materialistic values. During this period the prevalence of and mortality from myocardial infarction increased sharply to equal the situation in Bangor.”50 Roseto lost its unexplained health advantages at the same time it transitioned away from an interdependent lifestyle, leading many in the medical profession to conclude that community living was the protective factor all along.
Based on housing trends, our present society may be seeing the beginning of a resurgence in community living. Historical data show that our current circumstances — pandemic, economic recession, and ecological crisis — push us toward even more community-mindedness. This may be the silver lining on an otherwise dark cloud: though hardship may be increasing, our culture is becoming more focused on the needs of the vulnerable, poor, and elderly. We may even see less disease and longer lifespans for senior citizens if we fully embrace community as a lifestyle.
READ PART TWO:AN AGING POPULATION
PART ONE FOOTNOTES:
Go to Senior Living report navigation
1Achievements in Public Health, 1900-1999: Healthier Mothers and Babies. (2001, May 2). Retrieved July 13, 2020, from https://www.cdc.gov/mmwr/preview/mmwrhtml/mm4838a2.htm
2Kassel, K. (Ed.). (2020, February 5). Farming and Farm Income. Retrieved July 13, 2020, from https://www.ers.usda.gov/data-products/ag-and-food-statistics-charting-the-essentials/farming-and-farm-income/
3Borenstein, S. (2020, April 23). Bugged: Earth’s insect population shrinks 27% in 30 years. Retrieved July 13, 2020, from https://apnews.com/767ab6cab1fad77e824149aad0e4fee9
4Brown, E. (2018, November 01). Widely misinterpreted report still shows catastrophic animal decline. Retrieved July 13, 2020, from https://www.nationalgeographic.com/animals/2018/11/animal-decline-living-planet-report-conservation-news/
5Saltre, F., & Bradshaw, C. J. (2019, November 13). The earth’s sixth mass extinction event is underway. So are humans to blame? Retrieved July 13, 2020, from https://www.abc.net.au/news/2019-11-13/what-is-a-mass-extinction-are-we-in-one-now/11699372
6Stone, C., Trisi, D., Sherman, A., & Beltrán, J. (2020, February 11). A Guide to Statistics on Historical Trends in Income Inequality. Retrieved July 13, 2020, from https://www.cbpp.org/research/poverty-and-inequality/a-guide-to-statistics-on-historical-trends-in-income-inequality
7McKernan, S., Quakenbush, C., Ratcliffe, C., Kalish, E., & Steuerle, C. (2017, October 04). Nine Charts about Wealth Inequality in America (Updated). Retrieved July 13, 2020, from https://apps.urban.org/features/wealth-inequality-charts/
8Schaeffer, K. (2020, May 31). 6 Facts About Economic Inequality in the U.S. Retrieved July 13, 2020, from https://www.pewresearch.org/fact-tank/2020/02/07/6-facts-about-economic-inequality-in-the-u-s/
9Choi, J., McCargo, A., Neal, M., Goodman, L., & Young, C. (2020, May 04). Explaining the Black-White Homeownership Gap: A Closer Look at Disparities across Local Markets. Retrieved July 13, 2020, from https://www.urban.org/research/publication/explaining-black-white-homeownership-gap-closer-look-disparities-across-local-markets
10McKernan et. al., Nine Charts about Wealth Inequality
11Porter, M. E., Rivkin, J. W., Desai, M. A., Gehl, K. M., & Kerr, W. R. (2019, December). “A Recovery Squandered.” Retrieved July 13, 2020, from https://www.hbs.edu/competitiveness/research/Pages/research-details.aspx?rid=85
12McCarthy, N., & Richter, F. (2020, June 22). Infographic: U.S. Billionaire Wealth Surged During The Pandemic. Retrieved July 13, 2020, from https://www.statista.com/chart/22068/change-in-wealth-of-billionaires-during-pandemic/
13Stone, C. et. al. Trends in Income Inequality.
14Stiglitz, J. E. (2012, p. lii-liii). The Price of Inequality: How Today’s Divided Society Endangers Our Future. United States: W. W. Norton.
15Dimock, M., & Doherty, C. (Eds.). (2020, May 30). Public Trust in Government: 1958-2019. Retrieved July 13, 2020, from https://www.pewresearch.org/politics/2019/04/11/public-trust-in-government-1958-2019/
16Ibid.
17Boyle, J., PhD, Brassell, T., & Dayton, J. (2020, June 4). Survey: Trust in Government Response to COVID-19 Erodes. Retrieved July 13, 2020, from https://www.icf.com/insights/health/covid-19-survey-trust-government-response-erodes
18Goodhart’s Law. Oxford Reference. Retrieved 13 Jul. 2020, from https://www.oxfordreference.com/view/10.1093/oi/authority.20110803095859655
19Wiatrowski, W. (Ed.). (2017, February 02). Hedonic Quality Adjustment in the CPI. Retrieved July 13, 2020, from http://web.archive.org/web/20170712122320/https://www.bls.gov/cpi/cpihqaitem.htm via Wayback Machine version archived 12 Jul. 2017.
20Beach, W. (Ed.). (2019, January 15). Quality Adjustment in the CPI. Retrieved July 13, 2020, from https://www.bls.gov/cpi/quality-adjustment/home.htm
21Roser, M., & Ritchie, H. (2017). Price changes in consumer goods and services in the USA. Retrieved July 13, 2020, from https://ourworldindata.org/grapher/price-changes-in-consumer-goods-and-services-in-the-usa-1997-2017
22“David Ranson on Inflation - YouTube.” 20 Nov. 2009, https://www.youtube.com/watch?v=cufMzs2LEHo. Accessed 13 Jul. 2020.
23Chevreau, J. (2006). Inflation is Four Times Higher Than CPI, U.S. Economist Says. Retrieved July 13, 2020, from http://gata.org/node/4605
24Smith, C. (2016, August 01). The ‘Burrito Index’ has a way different view of inflation than the government does. Retrieved July 13, 2020, from https://www.businessinsider.com/burrito-prices-show-problem-with-inflation-measurements-2016-8
25Williams, J. (2020, June 10). Alternate Inflation Charts. Retrieved July 13, 2020, from http://www.shadowstats.com/alternate_data/inflation-charts
26Kotlikoff, L. (2019, May 14). Social Security just ran a $9 trillion deficit, and nobody noticed. Retrieved July 13, 2020, from https://thehill.com/opinion/finance/443465-social-security-just-ran-a-9-trillion-deficit-and-nobody-noticed
27Lambert, L. (2020, June 18). Another 1.5 million workers filed jobless claims in the past week—above economists’ expectations. Retrieved July 13, 2020, from https://fortune.com/2020/06/18/45-7-million-have-filed-unemployment-during-the-pandemic-greater-than-the-combined-population-of-23-states/
28Nesvisky, M. (2008, September). Public Pensions are Underfunded. Retrieved July 13, 2020, from https://www.nber.org/digest/nov08/w14343.html
29Olen, H. (2016, July). Boomers Face Savings Reality, Working Retirement. Retrieved July 13, 2020, from https://www.aarp.org/work/retirement-planning/info-2014/boomer-retirement-little-savings-means-working.html
30Mitchell, O., & Friedberg, L. (2018, August 23). Public Pension Crisis: Who Will Cover the $4 Trillion Shortfall? Retrieved July 13, 2020, from https://knowledge.wharton.upenn.edu/article/the-time-bomb-inside-public-pension-plans/
31Mauldin, J. (2019, May 20). The Coming Pension Crisis Is So Big That It’s A Problem For Everyone. Retrieved July 13, 2020, from https://www.forbes.com/sites/johnmauldin/2019/05/20/the-coming-pension-crisis-is-so-big-that-its-a-problem-for-everyone/
32Mihm, J. (2019). High Risk: Pension Benefit Guaranty Corporation Insurance Programs. Retrieved July 13, 2020, from https://www.gao.gov/highrisk/pension_benefit
33Malito, A. (2019, May 31). Don’t believe this myth about Social Security. Retrieved July 13, 2020, from https://www.marketwatch.com/story/dont-believe-this-myth-about-social-security-2019-04-23
34Schuster, A. (2020, April 22). McConnell says he favors allowing states to declare bankruptcy. Retrieved July 13, 2020, from https://www.illinoispolicy.org/mcconnell-says-he-favors-allowing-states-to-declare-bankruptcy/
35Dimock, M., & Doherty, C. (Eds.). (2020, May 30). Partisan Antipathy: More Intense, More Personal. Retrieved July 13, 2020, from https://www.pewresearch.org/politics/2019/10/10/partisan-antipathy-more-intense-more-personal/
36Andris, C., Lee, D., Hamilton, M., Martino, M., Gunning, C., & Selden, J. (2015, April 21). The Rise of Partisanship and Super-Cooperators in the U.S. House of Representatives. Retrieved July 13, 2020, from https://journals.plos.org/plosone/article?id=10.1371%2Fjournal.pone.0123507
37Scherer, M., Rebala, P., & Wilson, C. (2014, October 23). The Incredible Rise in Campaign Spending. Retrieved July 13, 2020, from https://time.com/3534117/the-incredible-rise-in-campaign-spending/
38Hughes, A. (2020, May 30). 5 facts about U.S. political donations. Retrieved July 13, 2020, from https://www.pewresearch.org/fact-tank/2017/05/17/5-facts-about-u-s-political-donations/
39Porter, M. E. et. al, “A Recovery Squandered”
40Ibid.
41Newport, F. (2018, June 24). Party Identification Varies Widely Across the Age Spectrum. Retrieved July 13, 2020, from https://news.gallup.com/poll/172439/party-identification-varies-widely-across-age-spectrum.aspx
42Jones, J. (2020, April 08). Americans Continue to Embrace Political Independence. Retrieved July 13, 2020, from https://news.gallup.com/poll/245801/americans-continue-embrace-political-independence.aspx
43US Census Bureau (2019, October 10). Historical Households Tables, Figure HH-4 The Rise of Living Alone. Retrieved July 13, 2020, from https://www.census.gov/data/tables/time-series/demo/families/households.html
44US Census Bureau (2019, October 10). Historical Households Tables, Figure HH-6 Changes in Household Size. Retrieved July 13, 2020, from https://www.census.gov/data/tables/time-series/demo/families/households.html
45Bianchi, E. (2016, October). American individualism rises and falls with the economy: Cross-temporal evidence that individualism declines when the economy falters. Retrieved July 13, 2020, from https://www.ncbi.nlm.nih.gov/pubmed/27668894
46Varnum, M. E., & Santos, H. C. (2017, July 13). Global Increases in Individualism. Retrieved July 13, 2020, from https://journals.sagepub.com/doi/full/10.1177/0956797617700622
47Fry, R. (2020, May 30). The number of people in the average U.S. household is going up for the first time in over 160 years. Retrieved July 13, 2020, from https://www.pewresearch.org/fact-tank/2019/10/01/the-number-of-people-in-the-average-u-s-household-is-going-up-for-the-first-time-in-over-160-years/
48Wolf, S., MD. (1967, January 01). Predictors of myocardial infarction over a span of 30 years in Roseto, Pennsylvania. Retrieved July 13, 2020, from https://link.springer.com/article/10.1007/BF02690896
49O’Donnell, G. (Ed.). (2015, February 15). The Italian Americans. Retrieved July 13, 2020, from https://www.pbs.org/video/italian-americans-introduction/
50Wolf, S., MD., Predictors of myocardial infarction